Custom Monitoring Stack: Difference between revisions
| Line 90: | Line 90: | ||
* Execute some checks locally on the same host | * Execute some checks locally on the same host | ||
* Execute other checks remotely via one or more JobRunner instances | * Execute other checks remotely via one or more JobRunner instances | ||
<br>[[image:Custom-setup04.png]]<br> | |||
This allows mixed deployments where local services are checked directly, | This allows mixed deployments where local services are checked directly, | ||
Revision as of 19:00, 3 January 2026
Custom Monitoring Stack
Modular monitoring with exporter, plugins, jobrunner and scheduler bases on the Prometheus Architecture
Overview
This system provides a lightweight monitoring framework built around:
| Component | Purpose |
|---|---|
| Exporter | Receives metrics and exposes Prometheus format |
| Plugins | Perform individual checks (ping, port, HTTP, cert, process) |
| JobRunner (optional) | Executes plugins remotely via HTTP |
| Scheduler (optional) | Orchestrates execution and intervals |
Design principles:
- Stateless checks
- JSON-only interfaces
- No SSH dependency
- Automatic metric expiry
- Prometheus-native output
Architecture
Logical Flow
The monitoring stack supports three execution models.
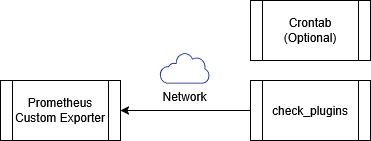
A: Direct execution via system scheduler (e.g. crontab)
In this model, plugins are executed directly by the system scheduler.
No scheduler daemon or remote execution is involved.
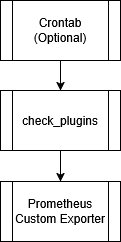
Check Plugins are able to write from host via the network to the exporter
Typical use cases:
- Simple hosts
- Minimal dependencies
- One-off or legacy checks
B: Local execution using the Scheduler
The Scheduler runs locally and executes plugins directly on the same system.

Typical use cases:
- Centralized scheduling
- Consistent intervals
- Local-only monitoring
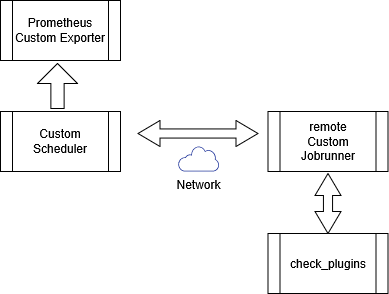
C: Remote execution using Scheduler and JobRunner
In this model, the Scheduler coordinates execution and sends requests to the JobRunner. The JobRunner executes plugins on remote hosts and returns the results back to the Scheduler.
The Scheduler then forwards metric payloads to the Exporter. The Exporter is not part of the execution chain and operates independently.
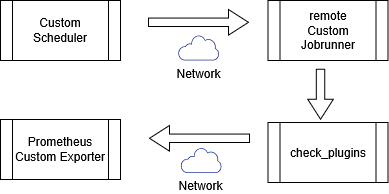
Another sample which is a bit odd and should only display the capabilties of the check_plugins as they can write dierectly to the custom exporter via network.
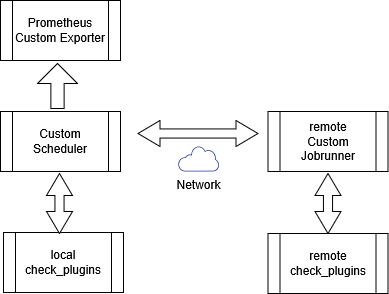
Combined Local and Remote Execution
Remote execution using JobRunner is **not mutually exclusive** with local execution using the Scheduler.
A single Scheduler instance may:
- Execute some checks locally on the same host
- Execute other checks remotely via one or more JobRunner instances
This allows mixed deployments where local services are checked directly,
while remote or restricted hosts are checked via JobRunner.
The execution method is selected per check based on scheduler configuration, not as a global operating mode.
Key characteristics
- JobRunner appears only once in the execution chain
- Downward flow represents execution requests
- Upward flow represents returned plugin results
- Scheduler receives and evaluates results
- Exporter is triggered only after results are processed
- No direct plugin-to-exporter communication
Typical use cases:
- Remote hosts
- No SSH access
- Firewalled or segmented environments
- Centralized orchestration
Exporter
Purpose
The exporter receives metrics via HTTP, stores them temporarily, and exposes them for Prometheus scraping.
Metrics automatically expire if not refreshed.
This is not a Pushgateway replacement.
Features
- HTTP push ingestion
- Metric TTL (expiry)
- Optional SQLite persistence
- Thread-safe in-memory storage
- Mandatory label validation
- Optional check timestamp metrics
Supported Metrics
| Metric | Description |
|---|---|
| check_ping | ICMP latency (ms) |
| check_tcp_port | TCP connect latency (ms) |
| check_proc | Process memory (RSS bytes) |
| check_http | HTTP latency or negative status |
| check_cert_expiry_days | Days until TLS expiry |
Mandatory Labels
| Label | Required | Meaning |
|---|---|---|
| source | Yes | Origin of the check |
HTTP Endpoints
| Endpoint | Method | Description |
|---|---|---|
| /push | POST | Accept metric JSON |
| /metrics | GET | Prometheus scrape endpoint |
Example Payload
{
  "metric_name": "check_ping",
  "value": 12.3,
  "expiry": 300,
  "time_label": 1,
  "labels": {
    "host": "example.com",
    "source": "scheduler"
  }
}
Security and Exposure
If the exporter is exposed beyond localhost or a trusted internal network, it **must** be placed behind a reverse proxy such as nginx.
Direct internet exposure of the exporter service is discouraged.
The reverse proxy is responsible for:
- TLS termination
- Authentication (Basic Auth, mTLS, or equivalent)
- IP allowlisting
- Rate limiting
- Request size limits
The exporter itself intentionally remains simple and does not replace an edge security layer.
Exporter Startup Arguments
The exporter is configured **exclusively via command-line arguments**. There is no static configuration file.
All runtime behaviour is derived from incoming metric payloads.
Supported Arguments
| Argument | Description | Default |
|---|---|---|
| --db | Path to SQLite database for metric persistence | Disabled |
Startup Load Sequence
- Parse CLI arguments
- Initialize SQLite (if enabled)
- Load non-expired metrics from DB
- Start expiry cleanup thread
- Start HTTP server
Plugins
Common Behaviour
All plugins:
- Are standalone executables
- Output structured JSON
- Support retries
- Support optional Basic Auth
- Support no export, allowing the scheduler to forward payloads
- Can run locally or remotely via the JobRunner
Plugin Summary
| Plugin | Function |
|---|---|
| check-ping | ICMP reachability |
| check-port | TCP connection latency |
| check-proc | Process memory usage |
| check-http | HTTP latency and content checks |
| check-cert | TLS certificate expiry |
check-ping
- Uses system ping
- Measures round-trip time
- Retries on failure
check-ping --host google.de --expiry 300 --time-metric
check-port
- TCP connect test
- Measures latency
- Supports arbitrary ports
check-port --host mail.example.com --port 587
check-proc
- Uses psutil
- Reports RSS memory
- Fails if process is missing
check-proc --name dockerd
check-http
- Measures HTTP latency
- Optional regex content search
- Optional redirect handling
Return values:
| Value | Meaning |
|---|---|
| >0 | Latency in ms |
| -2 | Pattern not found |
| -3xx | Redirect blocked |
check-http -w https://example.com -p "Welcome"
check-cert
- Opens TLS connection
- Reads certificate notAfter field
- Returns remaining days
check-cert --host example.com
JobRunner (Optional)
Purpose
JobRunner allows controlled remote execution of plugins via HTTP.
Features
- HTTP API
- Alias-based execution
- Sync or async execution
- Syslog logging
- No shell injection
- JSON output
Example Request
POST /run?alias=check-ping&args=--host example.com
Alias Configuration
joblist:
  - alias: check-ping
    cmd: /usr/local/bin/check-ping
Configuration Encryption
Sensitive values in **jobrunner.yaml** and **exporter.yaml** may be stored encrypted.
If plaintext or decrypted values are detected during load, JobRunner will automatically encrypt them using **Fernet** and persist the encrypted form.
This prevents accidental long-term storage of secrets in readable form while keeping configuration management simple.
Security and Exposure
If JobRunner is accessible from outside the local host or trusted network, it **must** be placed behind a reverse proxy such as nginx.
The reverse proxy should provide:
- TLS termination
- Authentication
- IP-based access control
- Rate limiting
JobRunner deliberately avoids implementing complex security logic and assumes a protected deployment environment.
Scheduler (Optional)
Purpose
The scheduler coordinates which checks run, where, and how often.
Configuration Files
| File | Purpose |
|---|---|
| hosts.yaml | Host inventory |
| services.yaml | Service definitions |
| commands.yaml | Local command paths |
| jobrunner.yaml | Remote runners |
| exporter.yaml | Exporter targets |
Execution Logic
- Load configuration
- Replace %hostname% placeholders
- Apply random startup delay
- Execute checks at interval
- Parse JSON output
- Forward metrics to exporter
Interval Syntax
| Format | Meaning |
|---|---|
| 30s | 30 seconds |
| 5m | 5 minutes |
| 1h | 1 hour |
| 1d | 1 day |
Python Module Requirements
Overview
The monitoring stack is written in Python and relies on a small set of well-known third-party modules in addition to the Python standard library.
| Component | Purpose | Python Modules |
|---|---|---|
| Exporter | Prometheus metrics endpoint | flask, prometheus_client, requests, cryptography |
| Scheduler | Job orchestration | pyyaml |
| JobRunner | Remote execution API | flask, pyyaml, cryptography |
| Plugins | Monitoring checks | requests, psutil |
Exporter
from flask import Flask
from prometheus_client import CollectorRegistry, generate_latest
from prometheus_client.core import GaugeMetricFamily
import requests
import sqlite3
Scheduler
import yaml
import threading
import subprocess
import time
JobRunner
from flask import Flask, request, jsonify
from cryptography.fernet import Fernet
import yaml
import subprocess
import logging
Plugins
import requests
import psutil
import socket
import ssl
import argparse
import json
import time
Python Version
- Python 3.8 or newer
- Python 3.11 recommended
Minimal Installation
pip install flask prometheus_client requests pyyaml psutil cryptography
Summary of Custom Monitoring Stack
This monitoring stack provides:
- Stateless plugin execution
- Prometheus-compatible metrics
- Automatic metric expiry
- Remote execution without SSH
- Central scheduling
- Clear JSON boundaries
- Automatic self-healing encryption of sensitive configuration values
It is intentionally simple, predictable, and easy to reason about.
